
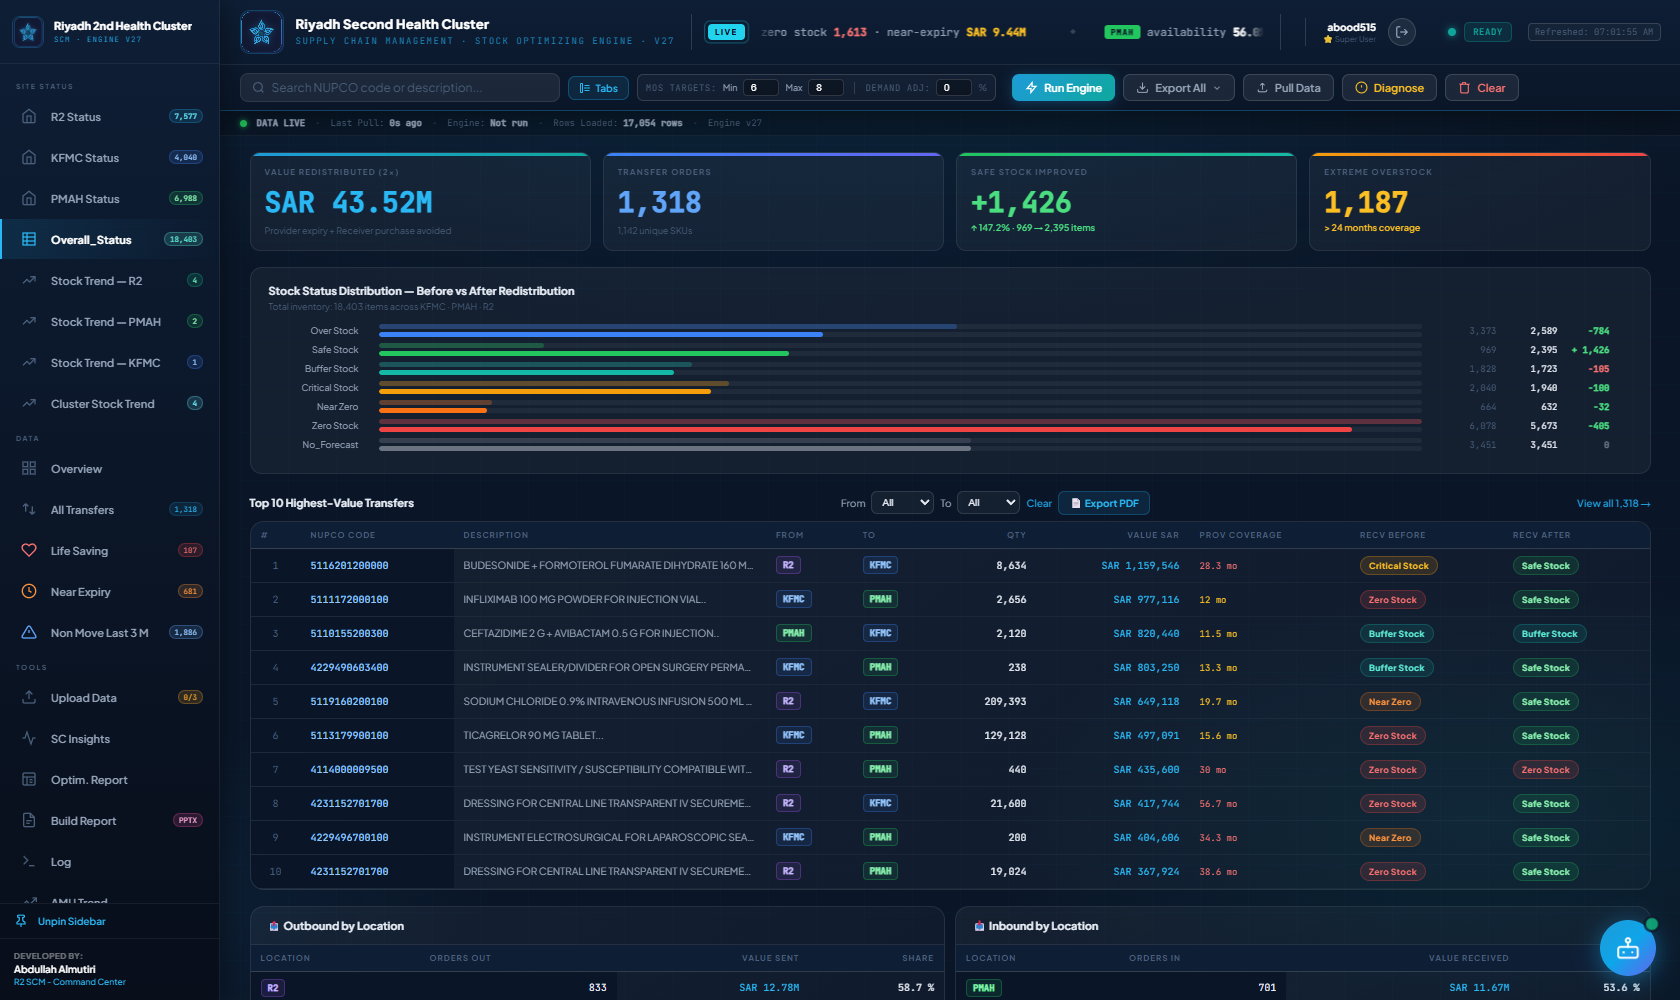
| # | NUPCO Code | Description | From | To | Qty | Value SAR | Prov Coverage | Recv Before | Recv After |
|---|
| Location | Orders Out | Value Sent | Share |
|---|
| Location | Orders In | Value Received | Share |
|---|
| Site | Orders Out | Value Sent (SAR) | Orders In | Value Received (SAR) | Net Position | Role |
|---|---|---|---|---|---|---|
| KFMC | — | — | — | — | — | — |
| PMAH | — | — | — | — | — | — |
| R2 | — | — | — | — | — | — |
Distribution of all transfer orders by the receiver site’s pre-redistribution stock status. Higher urgency categories indicate clinical risk mitigated by the engine.
The most active redistribution corridors ranked by total SAR value transferred.
The top 5 highest-value SKUs account for a significant share of total redistributed capital. These items should be prioritized for immediate logistics coordination.
Resolved
Transfers
Optimum Stock
Gain (months)
Zero Stock receivers typically show the highest gain since they start from 0 months. Over Stock receivers gain the least as they were already well-stocked.
• Each status row has TWO bars: a faded bar (Before redistribution) and a bright bar (After redistribution).
• The count shown is the number of transfer orders where the receiving site had that status.
• A shrinking red/orange bar = urgent cases rescued by the engine.
• A growing green bar = more receiving sites reached Optimum Stock after the transfer.
• The delta column in the legend shows net change: green = improvement, red = worsening (expected for Over Stock as it should shrink).
• Goal: Zero Stock & Critical should shrink to zero; Optimum Stock should be the dominant category.
| # | NUPCO | Description | From | To | Qty | Value SAR | Prov Cov ↓ | Prov Before | Prov After | Recv Before | Recv After | Recv Cov ↑ | Reason |
|---|---|---|---|---|---|---|---|---|---|---|---|---|---|
| Loading… | |||||||||||||
| # | NUPCO | Description | From | To | Qty | Value SAR | Prov Cov | Prov After | Recv Before | Recv After | Recv Cov | Reason |
|---|---|---|---|---|---|---|---|---|---|---|---|---|
| No life saving transfers loaded. Run the redistribution engine or fetch live sheet data. | ||||||||||||
| # | NUPCO Code | Description | Category | Formulary | KFMC | R2 | PMAH | KFMC Stock | KFMC NUPCO | KFMC DP | R2 NUPCO | PROCEED | PMAH NUPCO | Near-Exp Qty | Critical | Alternative |
|---|---|---|---|---|---|---|---|---|---|---|---|---|---|---|---|---|
| Upload a file or paste NUPCO or KFMC codes to check their status. | ||||||||||||||||
| NUPCO Code | Description | Date | R2 NUPCO | PROCEED | R2 Cov | PMAH NUPCO | PMAH Sub | PMAH Cov | KFMC NUPCO | KFMC Store | KFMC Cov | Updated By | Updated | |
|---|---|---|---|---|---|---|---|---|---|---|---|---|---|---|
| No entries yet — add one or bulk-upload a file. | ||||||||||||||
| Priority | Action | Scope | Owner | Impact |
|---|---|---|---|---|
| P1 · URGENT | Emergency procurement for 84 zero-stock SKUs | 84 SKUs | Procurement | Patient safety |
| P2 · HIGH | Execute top 46 high-value transfers (> SAR 100K) | SAR 8.4M | Warehouse Ops | Capital mobilization |
| P2 · HIGH | Return-to-vendor for items > 36 months coverage | 378 items | Category Mgmt | Expiry risk |
| P3 · MED | Establish AMU baselines for 1,108 no-forecast SKUs | 1,108 SKUs | Demand Planning | Engine coverage+6% |
| P4 · LOW | Schedule monthly redistribution cycles | Ongoing | SC Analytics | Continuous optimization |
Example: an item with no code at KFMC, used at R2, not used at PMAH → its sites are R2 and PMAH → "Used at some sites, not at others". The same item with stock at PMAH and zero at R2 → "Stock at some sites, zero at others — can transfer".
| NUPCO Code | KFMC Code | Description | Main Category | Formulary | LS / Crit | KFMC | R2 | PMAH | R2 Hospitals (12M) | AMU Activity | Risk Rating | |
|---|---|---|---|---|---|---|---|---|---|---|---|---|
| ⚡ Click ⬆️ Pull Data to load Overall_Status. | ||||||||||||
| ⚡ Loading Stock_Summary… |
| NUPCO Code | Description | Flags | KFMC | R2 | PMAH | AMU Activity | Risk Rating |
|---|---|---|---|---|---|---|---|
| ⚡ Loading from Overall_Status… | |||||||
| NUPCO Code | Description | Main Category | KFMC | R2 | PMAH | AMU Activity | Risk Rating |
|---|---|---|---|---|---|---|---|
| ⚡ Loading from Overall_Status… | |||||||
Why it matters: AX/AY/AZ cells (high value + unpredictable demand) deserve the closest attention — that's where stockouts are most expensive and hardest to forecast. CX items are the safest to run lean on.
| NUPCO Code | Description | Category | ABC | XYZ | Stock | Unit Price | Value (SAR) |
|---|---|---|---|---|---|---|---|
| ⚡ Loading… | |||||||
Sources by site (switch with the buttons above): KFMC — Planning AMU vs Avg Ordered 3M / 12M from the KFMC AMU Trend sheet · R2 — the R2 Status sheet's AMU vs the last 3 months ÷ 3 and the last 12 months ÷ 12 (the sheet's own 12M AMU column divides by 3, so it is not used) · PMAH — the PMAH Status sheet's AMU vs "AMU_Last 3M" / "AMU_Last 12M". vs last 12M (default) or vs last 3M picks the period for the tiles, charts and order; the table shows both. Status reads both periods: Accurate · Over-forecast · Under-forecast (off by 25%+ in both) · Demand rising / falling (the last 3 months differ 25%+ from the 12-month average) · Close — one period · No use in last 3M / 12M. Suggested AMU = a demand forecast: monthly demand (R2: issued + back-ordered · KFMC: requested) is cleaned of sheet errors and one-off spikes, its pattern classified (smooth / erratic / intermittent / lumpy, trend), six methods back-tested on the last 3 months (12- and 3-month averages, weighted moving average, exponential smoothing, Holt trend, Croston–SBA) and the most accurate one used. PMAH has no monthly history: its 12- or 3-month use + back orders. Click a number for the full reasoning and an AI review. 🤖 AI review reads these figures and writes the findings, actions and items to change. Needs Review: KFMC and PMAH use the sheet's own flag (PMAH: "Compare AMU To last 3M" = AMU NEED TO REVIEW); the R2 sheet has no such flag, so for R2 it marks items whose plan is more than 50% away from the last 3 months.
| Code | Description | Planning AMU | Actual 3M | Actual 12M | Bias 3M | Bias 12M | Suggested AMU | Status |
|---|---|---|---|---|---|---|---|---|
| ⚡ Loading… | ||||||||
Open PO = pending quantity on open purchase orders for that site (KFMC: FULL_SHIPMENT_DATA + NUPCO_SHIPMENT 7000; R2: NUPCO_SHIPMENT 1200; PMAH: NUPCO_SHIPMENT 2000). Stock + PO is compared with the Reorder Point: covered by the PO → no new order (expedite if the delivery date has passed); still below → Order qty = Reorder Point − (stock + open PO).
Rows highlighted red have current stock below their calculated Reorder Point — these are the ones to act on first. Adjust Lead Time and Service Level above to re-run the calculation live.
| Code | Description | Site | Current Stock | Safety Stock | Reorder Point | Open PO | Nearest delivery | Stock + PO | Order qty | Action |
|---|---|---|---|---|---|---|---|---|---|---|
| ⚡ Loading… | ||||||||||
Why "Risk" and not "Calendar": Overall_Status flags how many units are near-expiry, not the exact expiry date of each batch — so this view ranks exposure by site/category/item rather than showing a 30/60/90-day forward calendar. If batch-level expiry dates become available in a source sheet, this can be upgraded to a true calendar. Life-Saving Affected counts near-expiry items that are also flagged Life-Saving in Overall_Status — these deserve first priority for redistribution or urgent use before waste.
| Code | Description | Category | Site(s) | Near-Exp Qty | Value at Risk |
|---|---|---|---|---|---|
| ⚡ Loading… | |||||
Click an issue chip below to filter the table to just that problem type.
| Code | Description | Site | Issue |
|---|---|---|---|
| ⚡ Loading… | |||
| NUPCO Code | Description | Category | Site | Total Stock | Near Exp Qty | % at Risk | Value at Risk (SAR) | Stock Status | Status 3M | Life Saving | ||||
|---|---|---|---|---|---|---|---|---|---|---|---|---|---|---|
| 🔁 Loading near-expiry inventory data… | ||||||||||||||
| NUPCO Code | Description | Category | Site | Total Stock | Stock Value (SAR) | AMU | AMU 3M | Status (Current) | Status 3M | Status 12M | Life Saving |
|---|---|---|---|---|---|---|---|---|---|---|---|
| ⚡ Click Pull Data to load non-moving inventory. | |||||||||||
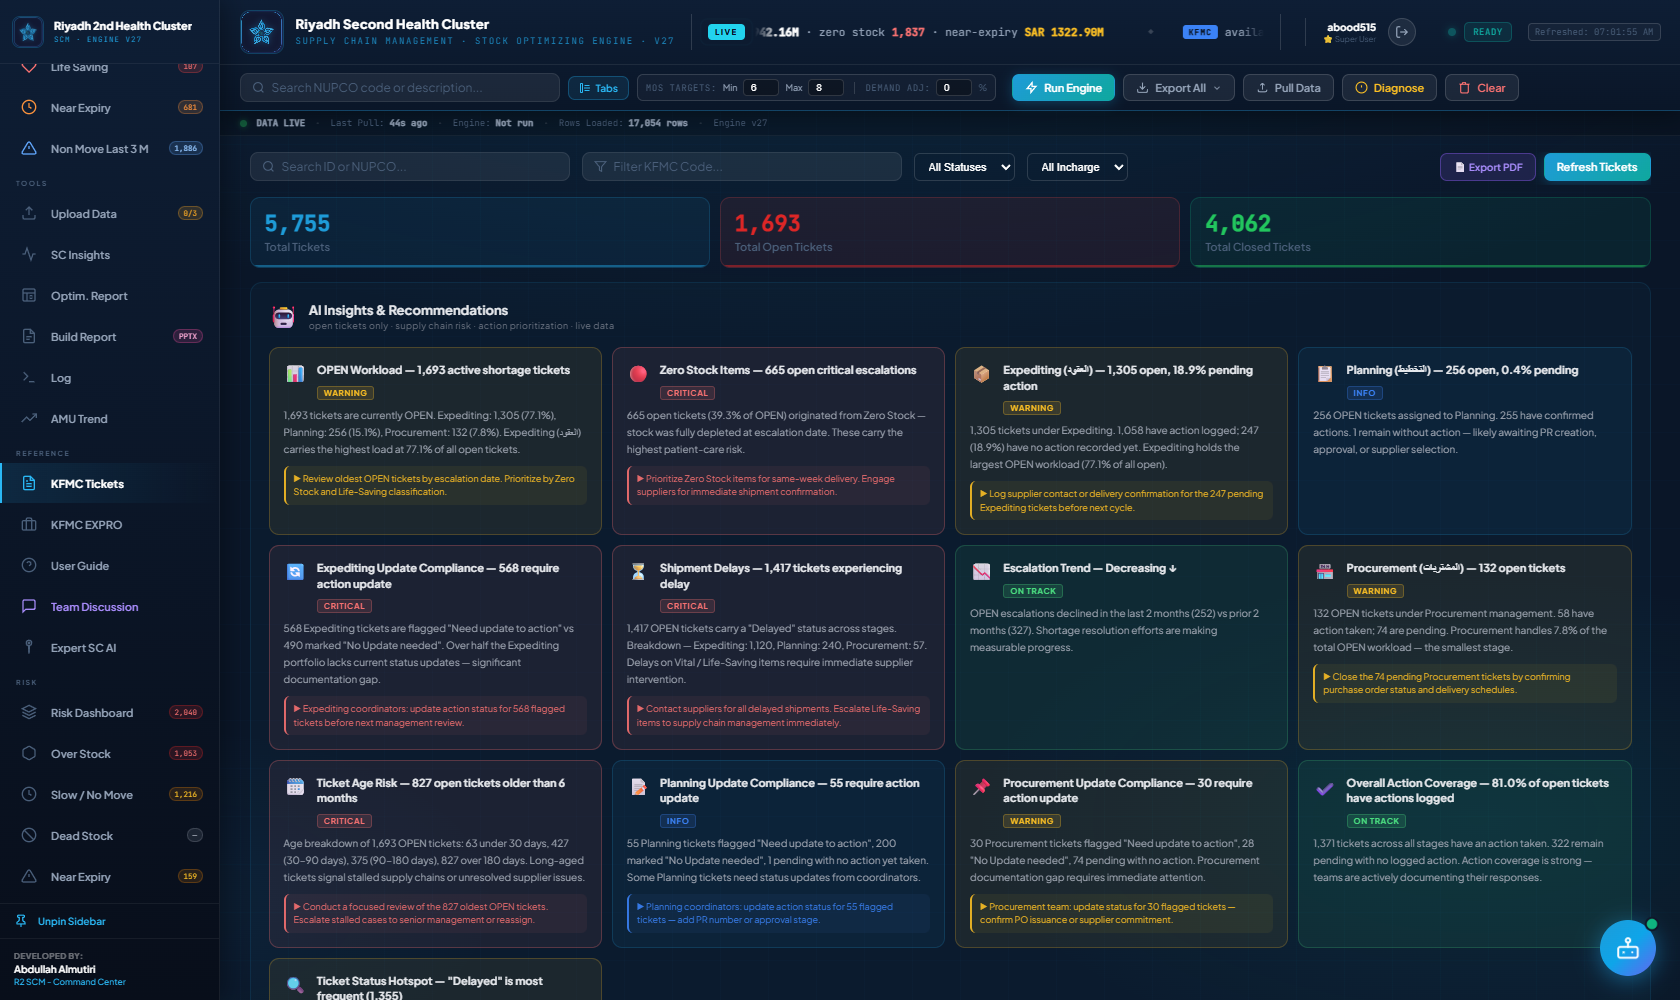
KFMC Tickets
| Status | Ticket | Escalated | KFMC | Description | Stock at escalation | With | Planning | Expediting | Procurement | Stage | Duration | Closed / escalated by | |
|---|---|---|---|---|---|---|---|---|---|---|---|---|---|
| Open the tab to load tickets. | |||||||||||||
| Ticket | Escalated | Closed | Duration | KFMC | Description | Stock at escalation | Last with | Planning | Expediting | Procurement | Closed by | Reason |
|---|
Analysis ticket flow, charts, owners, workload and scorecard
| Loading transfer requests… |
| Status | Escalation Date | KFMC Code | Description | Stock Status | Incharge | Action (Planning) | Note (Planning) | Action (Expediting) | Note (Expediting) | Action Date (PROCUREMENT) | Note (PROCUREMENT) |
|---|---|---|---|---|---|---|---|---|---|---|---|
| Loading KFMC Tickets... | |||||||||||
or click + Add Task to add items manually.
The AI has full context — items, coverage, FR, financials, categories.
Use your existing API key from the AI Analysis Engine above.
| Load AMU Trend data first, then click KFMC EXPRO in the sidebar. |
SCM Command Center — Complete User Guide
A comprehensive reference for all users of the Riyadh Second Health Cluster Stock Redistribution Engine. Covers navigation, data upload, KPI interpretation, transfer analysis, export options, engine logic, and strategic recommendations.
Upload an Excel/CSV list of NUPCO codes (or paste a column from Excel) and get every item's status, stock by location, AMU, open & over-stock qty, near-expiry and substitutes across KFMC/R2/PMAH — the same lookup as the "check" sheet, run against all 12,000+ items. Includes a Template download, Clear, and Export Excel.
From any Check Status row, export a one-item PDF card: every field, a weekly stock trend per site, a weekly open-order trend, and KFMC's month-by-month requested vs shipped.
A dated NUPCO stock database for the six physical stores. Each upload is saved as its own snapshot date — pick a date to view it; older dates are never overwritten. Accepts NUPCO "Stock On Hand" exports directly (lots summed per item).
Same 6–8 month coverage band, new name — across every tab, chart, filter chip, ticker and export. The source sheets still say "Safe Stock"; the dashboard translates it on load.
On Overall_Status, the Formulary Gaps chart is now a bar chart by exact site combination (e.g. ⬜ KFMC ✅ R2 ✅ PMAH), so you can see which site is behind each gap.
"Capture This Week" now also saves each item's open-order qty for KFMC/R2/PMAH, building the order trend on item cards. PMAH is captured again after its sheet's column names changed.
Three new sidebar tabs (KFMC Risk / R2 Risk / PMAH Risk) compute Over Stock, Zero Stock, Critical Coverage, Slow/No-Move, Near Expiry and Double Risk live from each site's own Status data — click a KPI tile to filter the Top Risk Items table. See the Risk Dashboards section below.
R2/KFMC/PMAH Status each gained a Main Category checklist and Life_Saving/PICU/NICU checkboxes in the top toolbar, and every filter on those tabs (and Overall_Status) now updates the KPI tiles and every chart, not just the table.
New cards at the top of SC Insights show live availability%, zero/critical stock, life-saving items at risk, near-expiry value and a top recommended action for R2/KFMC/PMAH — click a card to jump to that site's Status tab.
The scrolling bar now also shows per-site Stock Status breakdowns plus cluster-wide and cross-site life-saving totals. A second bar underneath shows the top recommended action for life-saving items per site. Superusers can post Announcements that ride the first bar — see Settings.
Superusers can now choose exactly which sidebar tabs Viewers and Managers see, and post the Announcements that appear in the header ticker.
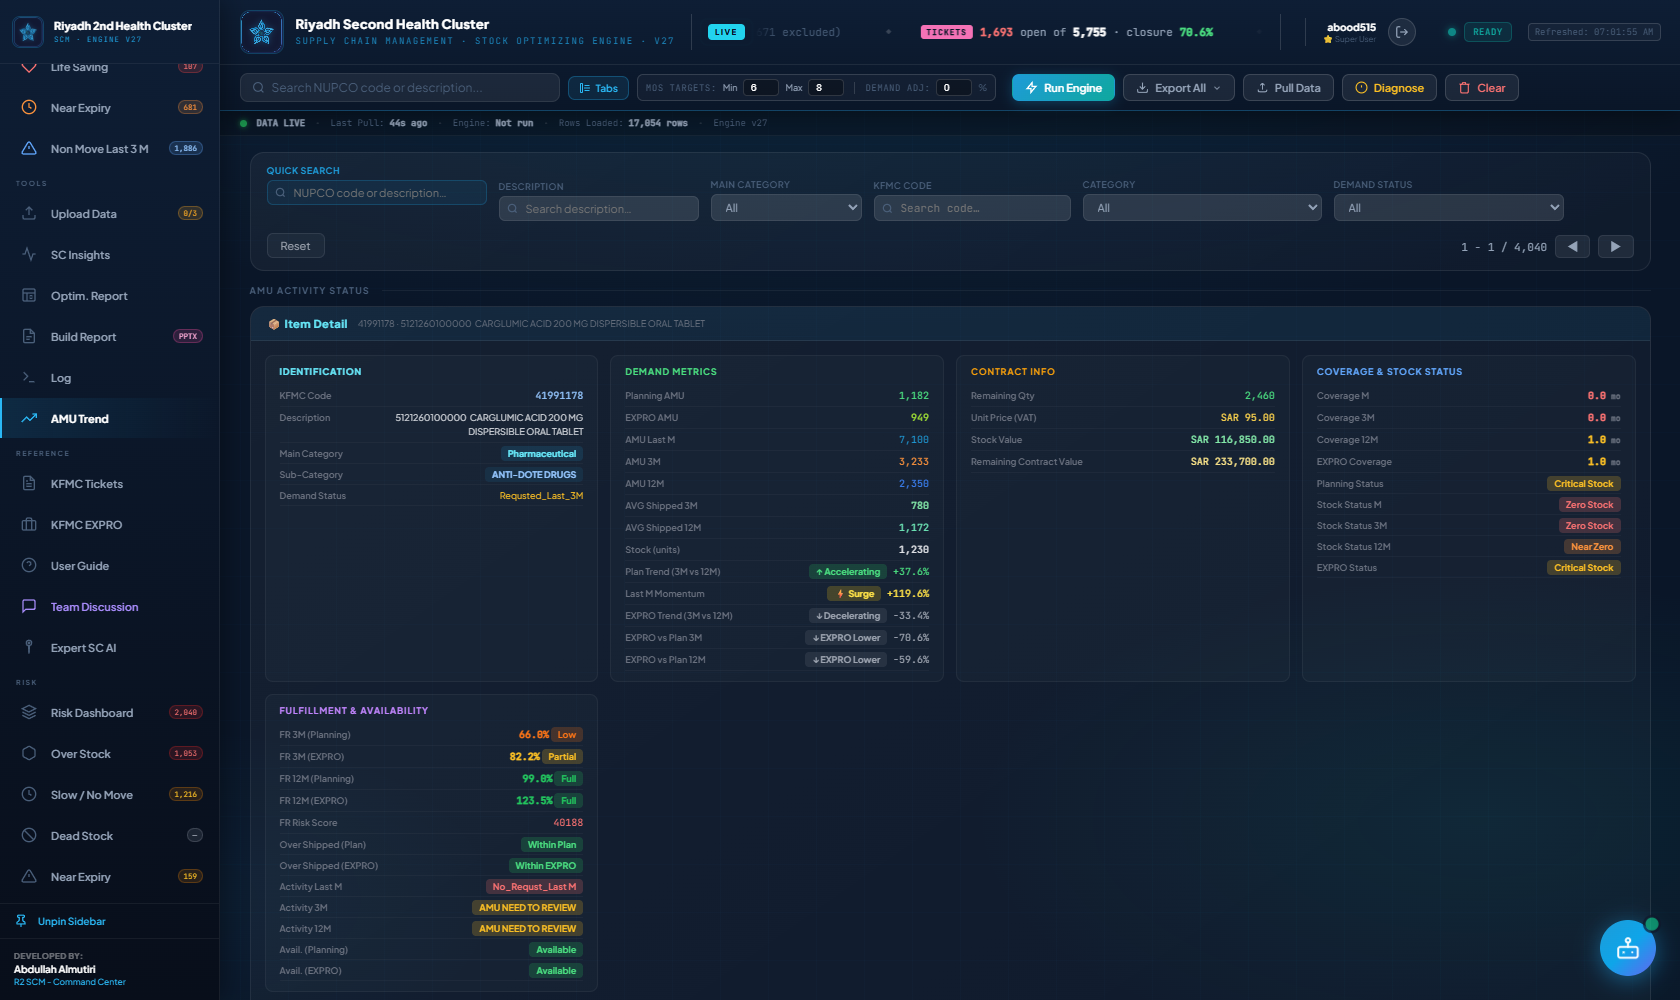
A new panel shows exactly how AMU Planning, EXPRO AMU, Avg Ordered 3M/12M (renamed from "AMU 3M/12M") and Fulfillment Rate are calculated, and every row in the Item Detail panel now has a hover tooltip with its exact formula.
Pull Data now reads from Overall_Status instead of the old master sheet, split per site (KFMC/R2/PMAH), with unit prices joined from a dedicated, curated prices sheet — see AMU Trend's Item Detail panel for the exact formulas.
Signing in opens straight into Overall_Status instead of Overview — the fastest place to check any item across all three sites at once.
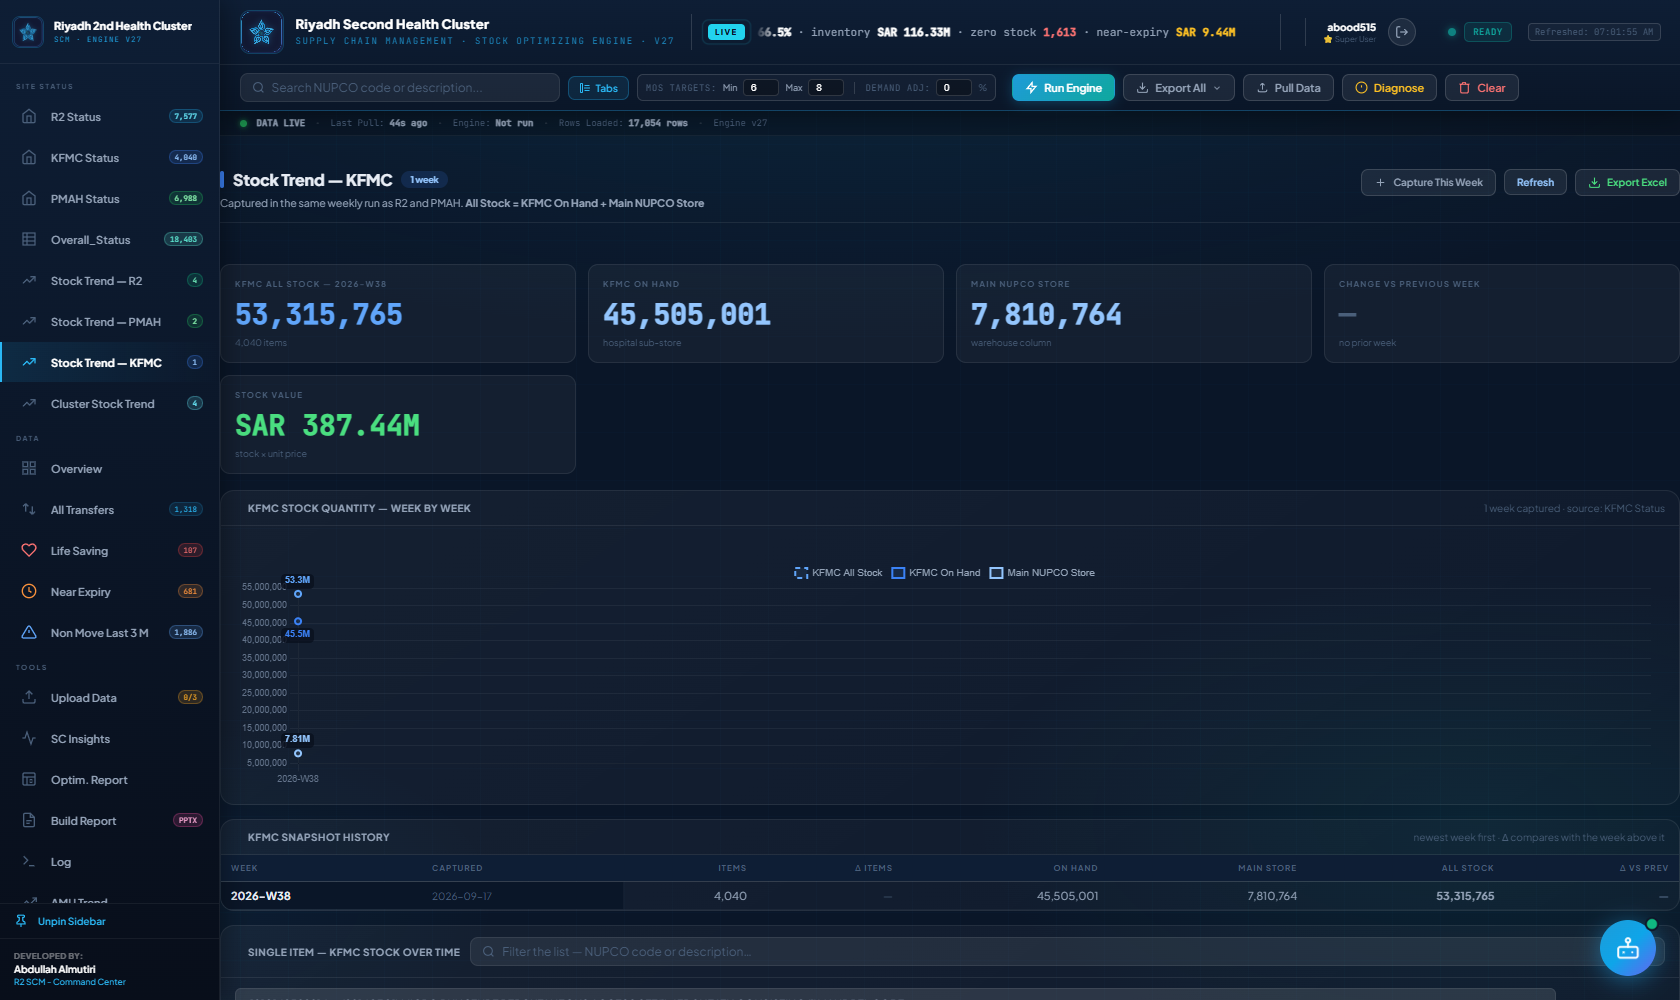
Weekly KFMC stock chart, snapshot history, per-item drill-down and Excel export — the same tool R2 and PMAH already had.
New checklist board on KFMC Status — auto-fill it from the current Recommended Actions, or add tasks by hand with priority, owner, start/end dates and a note. Shared live with the whole team (not just your browser).
Expanding a KFMC item card now shows a full reasoned recommendation (URGENT ORDER, WRITE OFF, REDISTRIBUTE, etc.) with the numbers behind it — and every open ticket gets its own urgency read (URGENT ESCALATE / NEEDS UPDATE / ON TRACK / MONITOR).
A KFMC item's Open Tickets now show the full trail — shipment, PR, and the Planning/Procurement/Expediting action stages with their dates and notes — not just a one-line summary.
ABC/XYZ Classification (value vs. demand-variability matrix), Forecast Accuracy Scorecard (Planning AMU vs. actual), Safety Stock & Reorder Point calculator, Expiry Risk, and Data Quality / Audit — all reading live from Overall_Status. See the sidebar's ANALYTICS section, right under SITE STATUS.
A single composite score (stock status + life-saving + near-expiry + AMU-needs-review + over-stock) now appears as a column on Overall_Status, Life Saving Status, Non Move Last 3M, and every Risk Dashboard's Top Risk Items table. Thresholds are configurable in Settings → App Defaults.
New AI, RISK and ANALYTICS sections now sit right under SITE STATUS. Two new cluster-wide tabs — Life Saving Status and Non Move Last 3M — were added under SITE STATUS, sourced straight from Overall_Status (distinct from the similarly-named tabs under REDISTRIBUTION, which come from the redistribution engine).
The Expert SC AI tab connects through the same Claude/DeepSeek connection as the floating SC Expert AI Chat widget (bottom-right corner) instead of running a separate Gemini setup — connect once, use from either place. A status badge in the tab shows whether it's connected.
Each Risk Dashboard's Top Risk Items table now shows every flagged item (not just a top-20/50 cutoff), 50 per page, sortable by Value at Risk or Qty — plus new Qty, AMU and AMU Activity columns.
Superusers can now tune the ABC/XYZ Pareto cutoffs, Risk Rating score thresholds, and Safety Stock calculator defaults — shared live with the whole team via Firestore, same as Tab Visibility.
The PPTX generator now includes a month-over-month trend table per site, pulled from the same saved Risk Dashboard snapshots — see Build Report's slide checklist.
| I want to… | Go to |
|---|---|
| Check one item's stock across KFMC, R2 and PMAH at once | Overall_Status — opens automatically on sign-in |
| See what needs to be ordered, written off, or redistributed at KFMC right now | KFMC Status → Recommended Actions table, or expand any item's card for the full Recommendation & Analysis |
| Track a to-do list of action items with owners and dates | KFMC Status → Action Plan Tracker panel |
| Check on an escalation / shipment / PR status for a KFMC item | Expand the item's card on KFMC Status for its Open Tickets, or open KFMC Tickets for the full list |
| See a site's weekly stock trend over time | Stock Trend — R2 / KFMC / PMAH (one tab per site) |
| Follow one specific item's stock across all three sites, week by week | Cluster Stock Trend |
| See the cluster-wide redistribution plan and its financial value | Overview for the summary, All Transfers for the full sortable list |
| Find items at risk of expiring before they're used | Near Expiry (redistribution view) or Risk Dashboard → Near Expiry (KFMC-only, deeper detail) |
| Understand how AMU, coverage, or stock value is calculated | KFMC AMU Trend → Item Detail panel's "How the Contract Info values are calculated" note, or User Guide → SCM Engine Logic below |
| Ask a free-form question about the data | KFMC EXPRO → SC Expert AI Chat panel |
| Bring in my own Excel inventory instead of the live sheets | Upload Data |
| Check a list of NUPCO codes at once (from Excel or pasted) | Check Status → Upload NUPCO list, or paste codes and press Check |
| Print or share one item's full record with its stock & order trend | Check Status → the 📄 icon on the item's row (item card PDF) |
| Record or look up NUPCO stock per physical store on a given date | Stock Data → pick a Viewing date, or Bulk Upload with a Snapshot date |
| Build a PowerPoint report to share outside the dashboard | Build Report |
| Post a question or discuss something with the team (non-urgent) | Team Discussion |
| Approve new accounts or change someone's role | Manage Users — manager/owner accounts only |
Click ⬆️ Pull Data
Toolbar button fetches live data from Overall_Status (one row per NUPCO code, KFMC/R2/PMAH side by side), splits it into a per-site record for each, joins in a clean unit price from a dedicated prices sheet, and loads them automatically. Watch the Log tab for progress.
Click ⚡ Run Engine
Runs the redistribution algorithm on pulled data. Generates transfer orders and updates all tabs instantly.
Review Results
Check Overview KPIs, browse All Transfers, view All Status Data for the full raw inventory picture, then Export.
Download Template
Go to Upload Data tab → download the Excel template for each site (KFMC, PMAH, R2).
Fill In Inventory Data
For each site: fill NUPCO Code, Description, Current Stock, AMU, Unit Price SAR. Paste values only — no formulas.
Upload & Run
Drag & drop into Upload Data tab. Load at least 2 of 3 sites, then click ⚡ Run Engine.
Review & Export
Filter results in All Transfers, check SC Insights alerts, browse All Status Data for the full inventory view, then export.
Items exceeding 24 months are flagged as extreme overstock. Items > 36 months should be escalated to return-to-vendor review.
Coverage Formula
Transfer Quantity Formula
Prov Stock − (8 × Prov AMU),
(8 × Recv AMU) − Recv Stock
)
Inventory Velocity Index
What are Turns? Represents the annualized inventory turnover rate. A rate of 4.3x means the cluster's average inventory is consumed and replenished 4.3 times a year. High velocity prevents stock stagnation and expiration.
Mobilization Logic: Baseline velocity is 3.8x/Year. When the engine identifies and redistributes excess/non-moving stock (over 8.0 MOS) to shortage locations, it converts stagnant capital into active consumption, driving velocity up by +0.2 turns per SAR 10M mobilized.
Benefits: Avoids emergency purchasing costs, reduces warehouse carrying costs, minimizes shelf expiry rates, and maximizes cluster-wide capital efficiency.
Allocation Rules
- Source eligibility: Provider coverage must exceed 8.0 months
- Target ceiling: Receiver replenished up to 8.0 months max
- Priority order: Zero Stock → Near Zero → Critical Stock → Buffer
- Value sorting: Higher SAR transfers ranked first within equal priority
- Site neutrality: Any site can be both provider and receiver for different SKUs
Simulation & Tuning Parameters
- MOS Targets: Adjust Min/Max thresholds dynamically in the header to modify provider source eligibility and receiver replenishment ceilings.
- Demand Adj: Scale AMU by a percentage (e.g. +10% for seasonal demand peaks) to test network sensitivity to consumption rate shifts.
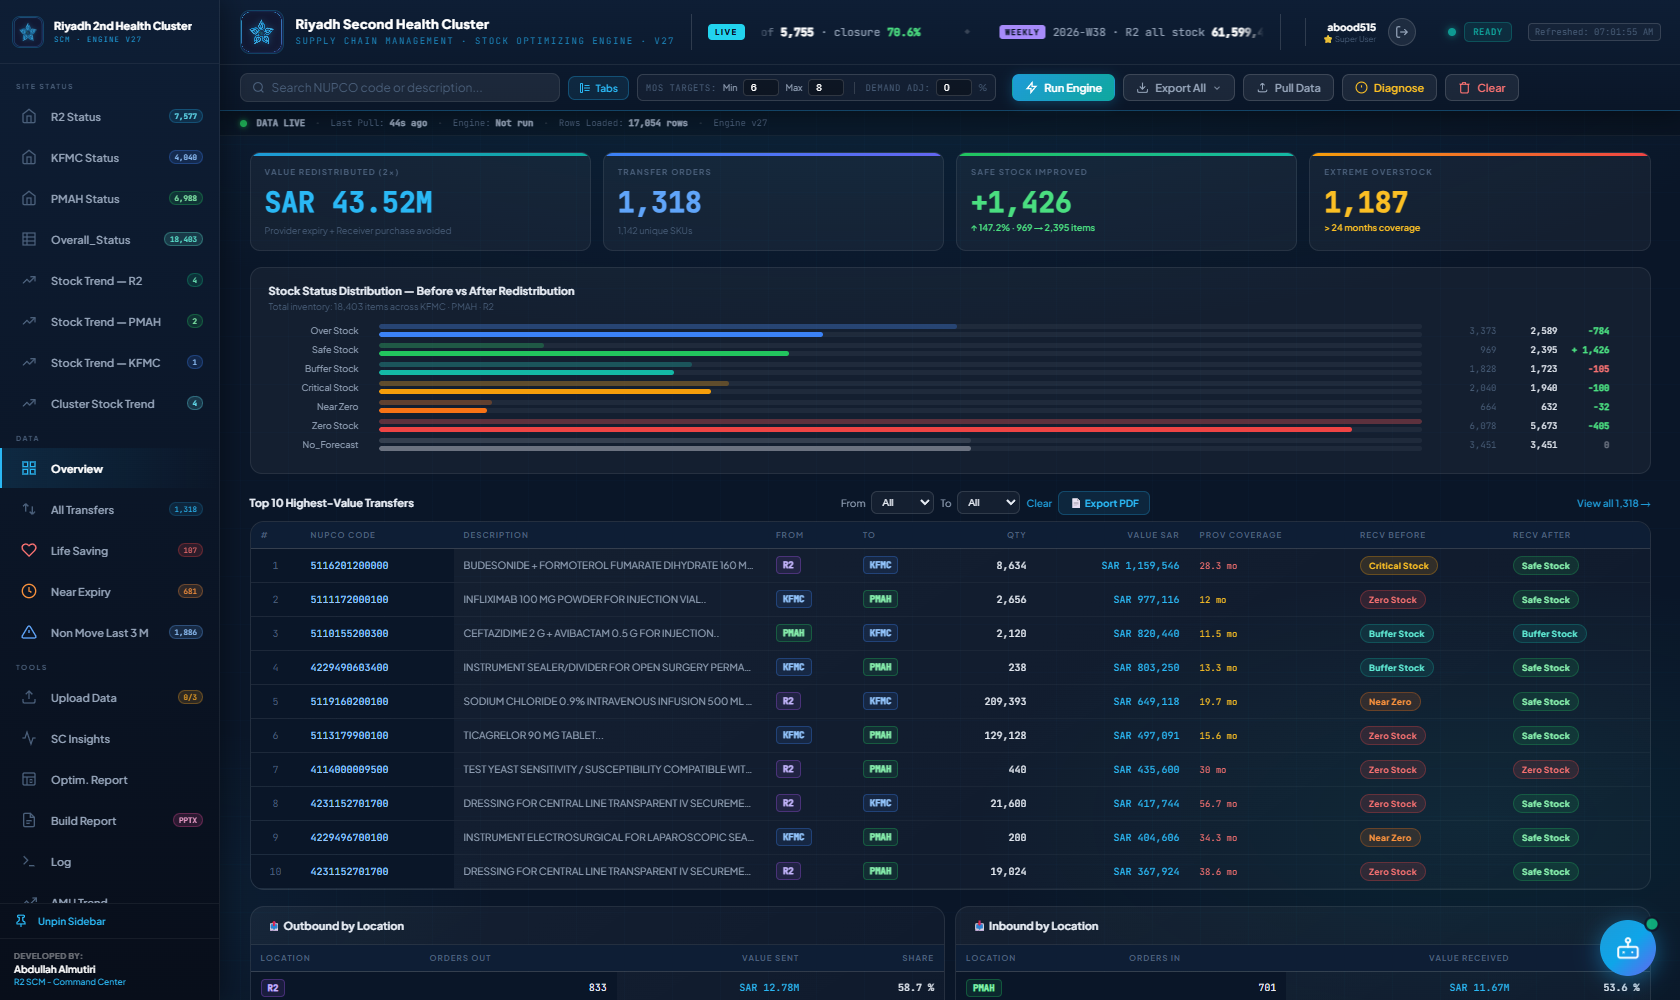
Command center home. Shows 5 KPI cards, Before/After stock distribution chart, top 10 highest-value transfers, and site Inbound/Outbound summaries. All cards are clickable.
Full sortable/filterable table of all transfer orders. Filter by site, pre-status (Zero Stock / Near Zero / Critical / Buffer), or minimum SAR value. Paginated at 50 rows. Click column headers to sort.
Filtered view showing only Life Saving Item transfers. Red badge shows count. Use for emergency prioritization and clinical governance reporting.
Redistribution-focused view: items with near-expiry quantities (Near Exp Qty > 0) that can be transferred to sites actively consuming them. Distribution charts by site and top 5 SKUs by near-expiry count. Exportable to CSV.
Items with no consumption in last 3 months (Stock Status-3M = NO REQUEST). Charts by site and top 5 non-moving SKUs by stock value. Use to identify slow-moving stock before it converts to dead stock.
Live table of all 18,500+ inventory rows from R2 SCM DataBase. Shows AMU 3M/12M, three stock-status readings, near-expiry qty, Life Saving flag. Filter by site, status, or Life Saving. Export as CSV.
Upload fresh inventory Excel files per site (KFMC, PMAH, R2). After loading ≥2 sites the Run Engine button activates. Download templates here first. Load all 3 for full network analysis.
Opens with 3 Live Site Status cards (R2/KFMC/PMAH) showing live availability%, zero/critical stock, life-saving items at risk, near-expiry value and a top recommended action — click a card to jump to that site's Status tab. Below that, the original strategic insight cards ranked by severity, plus the Prioritized Action Plan table.
Controls which sidebar tabs Viewers and Managers can see, manages Announcements for the header ticker, and (new) App Defaults — ABC/XYZ Pareto cutoffs, Risk Rating score thresholds, and Safety Stock calculator defaults.
Real-time terminal showing engine operations, file parse results, computation steps, and errors. Use to trace activity or diagnose loading issues. Shows row counts, computation time, and any skipped SKUs.
Complete documentation for all dashboard features, formulas, data requirements, export options, and all 9 Risk tabs with examples — this page. Updated with every release.
A/B/C by cumulative share of inventory value (Pareto). X/Y/Z by demand variability (coefficient of variation across AMU Last M / 3M / 12M from the KFMC AMU Trend sheet, joined by KFMC Code). "Unclassified" means no KFMC Code match — usually an R2/PMAH-only item. Cutoffs are configurable in Settings → App Defaults.
Bias % = (Planning AMU ÷ Actual Ordered 3M − 1) × 100 — positive means the plan runs above what departments actually ordered. Scoped to the KFMC AMU Trend sheet, the only source with a true plan-vs-actual split.
Interactive calculator: set lead time (days) and service level (90/95/98/99%), and it computes Safety Stock and Reorder Point per item, flagging anything currently below its ROP. Defaults come from Settings → App Defaults.
Near-expiry quantity × unit price, by site and Main Category. Overall_Status only carries a near-expiry quantity, not batch expiry dates, so this ranks value-at-risk rather than showing a day-by-day calendar.
Flags rows with missing Description, AMU, Unit Price, or Main Category, and duplicate NUPCO codes — issues that quietly break the math on other tabs. Click an issue chip to filter the table.
A composite LOW/MEDIUM/HIGH/CRITICAL badge (stock status + life-saving + near-expiry + AMU-needs-review + over-stock) appears on Overall_Status, Life Saving Status, Non Move Last 3M, and every Risk Dashboard's Top Risk Items table. Score cutoffs are configurable in Settings → App Defaults.
Any Announcements a superuser has posted scroll first (colored NOTICE/WARNING/URGENT tags), then live per-site tags for R2, PMAH and KFMC — availability%, inventory value, zero stock, near-expiry, and each site's Stock Status breakdown (critical/buffer/safe/over). Followed by a CLUSTER tag (combined SKUs/value/zero-stock across all 3 sites) and an OVERALL tag (cross-site life-saving/PICU/NICU counts from Overall_Status), then open tickets and the latest weekly R2 snapshot delta.
Filtered to life-saving items only. For each site, shows how many life-saving items are flagged with a critical recommended action (WRITE OFF / URGENT ORDER / ORDER NOW) and the single most urgent one by name — the same rule-based recommendation engine used on every item's detail card.
A "Main Category" button opens a checklist of every category with its SKU count — tick one or more to show only matching items. Selecting no categories shows everything.
Three checkboxes read straight from the sheet's combined "Life Saving Item" checkbox field (e.g. "✅ Life_Saving ⬜ PICU ⬜ NICU"). Check any combination to filter to items matching at least one — e.g. check PICU and NICU to see items flagged with either.
Every filter on these tabs — Main Category, Life_Saving/PICU/NICU, Exclude Inactive 12M, search, and the Activity/Stock Status/Requested/Flags chips — now updates the KPI tiles and every chart, not just the table. The one exception: clicking a chart segment to drill in still only filters the table, so the chart itself stays showing the full picture.
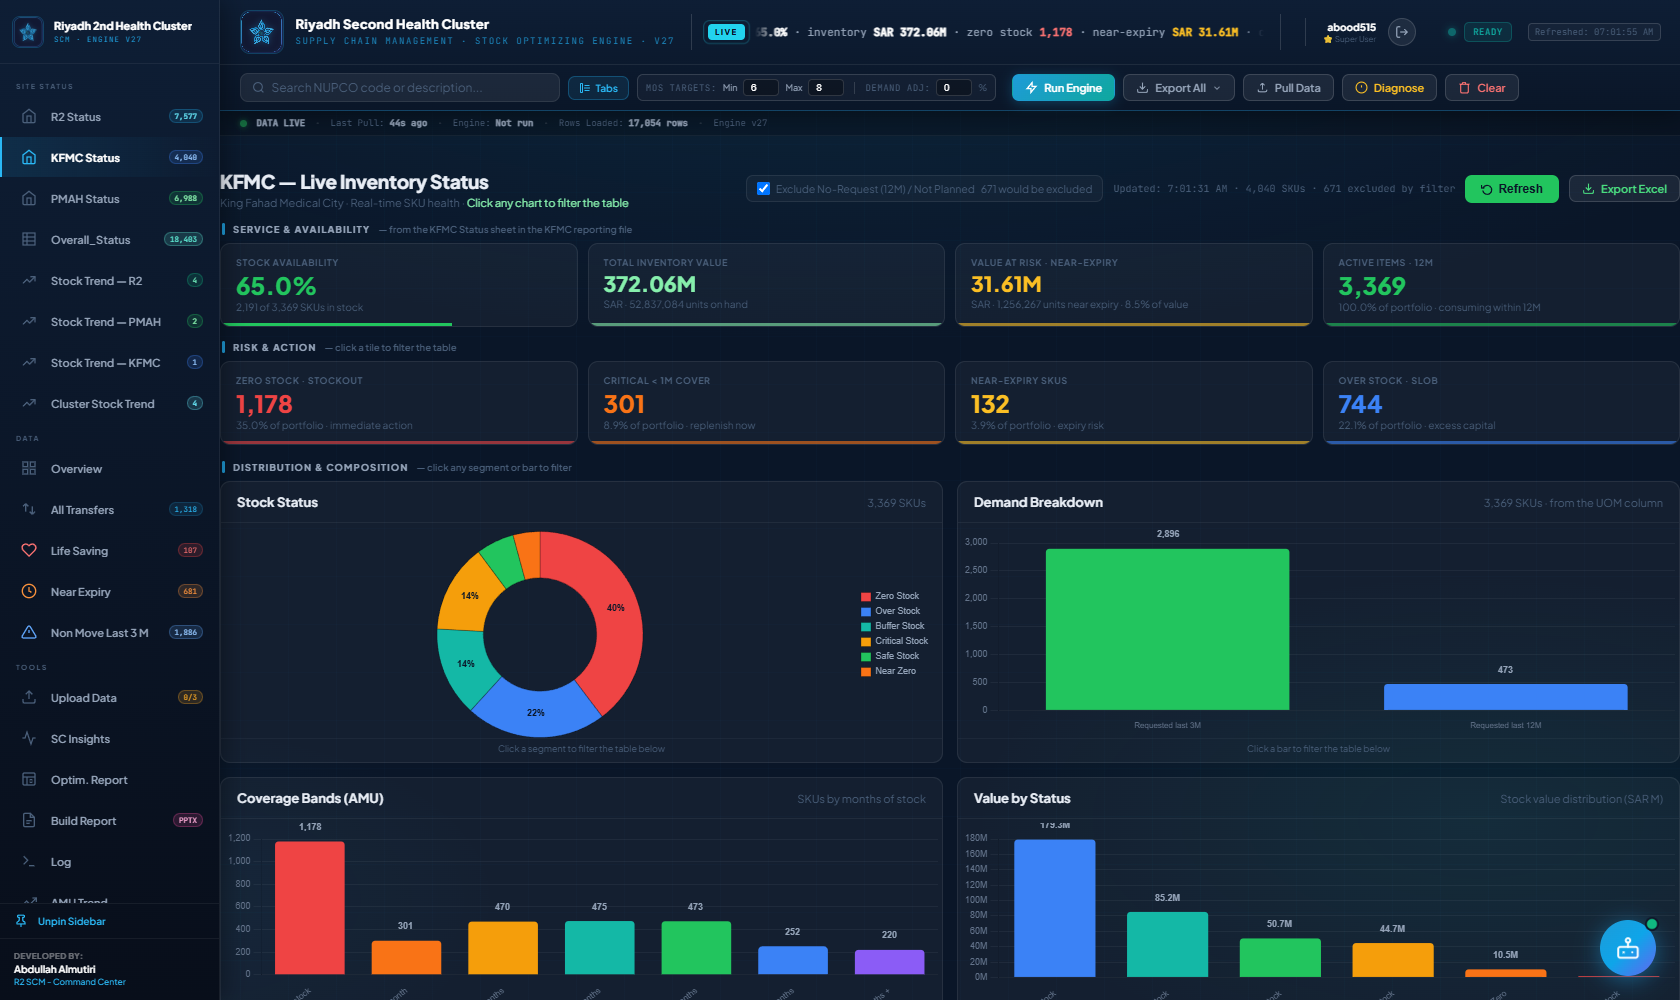
kmScope() / r2Scope() / pmScope() — the same already-validated data behind the R2/KFMC/PMAH Status tabs), not a stored snapshot. This is different from the older SCM Stock Risk Dashboard module described further below, which still uses a static June 2026 snapshot for KFMC only.
Total SKUs, Over Stock (count + SAR tied up), Zero Stock with active demand, Critical <1 month coverage, Slow-Move, No-Move, Near Expiry (count + SAR at risk), and Double Risk (Over Stock and Near Expiry together — the highest write-off exposure).
Click any KPI tile and the Top Risk Items table below filters to just that category, with a "filtered to X · clear" indicator. Click the tile again to go back to the combined view. The table shows every flagged item, 50 per page — use Sort (Value at Risk / Qty) and Prev/Next to page through the full list.
A Risk Category Breakdown bar chart and Near-Expiry-by-Category doughnut, both by Main Category, plus an Inventory Health Scorecard comparing each metric's current % of the formulary against a benchmark target (On Target / Above Target).
Every item flagged Over Stock, Slow-Move, No-Move or Near Expiry, deduplicated and sorted by value at risk, with a badge for each flag it carries. A red Double-Risk alert banner appears whenever any items are both Over Stock and Near Expiry.
Command center for the full risk picture. Shows 9 live KPI cards (Total Risk, Over Stock, Slow/No Move, Near Expiry, Double Risk, On-Hand Units, Zero Stock, Critical Coverage, Unplanned Active), two alert banners, Inventory Health Scorecard vs benchmarks, and 28 dynamic Expert Recommendations ranked CRITICAL → LOW.
Full table of all Over Stock items (stockStatus = "Over Stock"). Filter chips at top: All / Pharmaceutical / Medical Supply / Non-Medical / Also Near Expiry. Planner dropdown for planner-specific view. Category breakdown table shows OS, SM, and NE counts per main category.
Items with no or limited demand history. Filter chips: All / Dead Stock (no request last 12M) / Slow Moving (requested last 12M but not last 3M). Both types are included in the combined Slow/No-Move KPI (1,215 items in Jun-26). Dead Stock sub-count: 347.
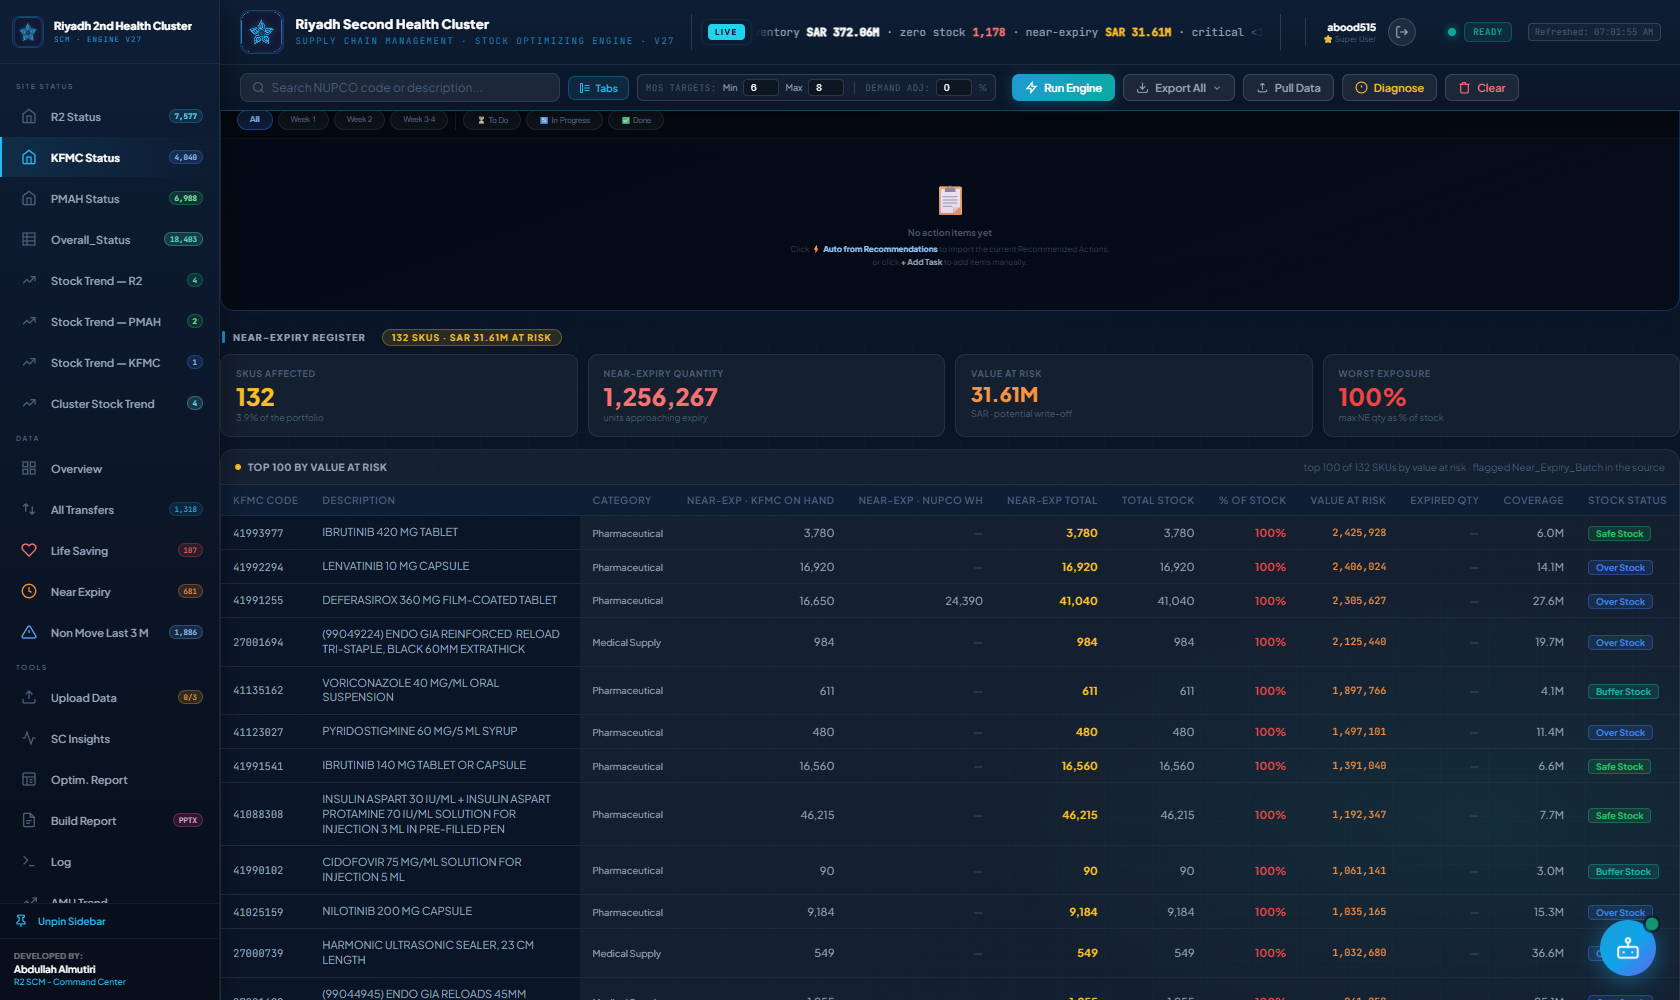
Items flagged by NUPCO as Near_Expiry_Batch — batch expires in <90 days. Shows 160 items in Jun-26 across Pharmaceutical (105) and Medical Supply (54). Click any row to open the item detail panel.
Near_Expiry_Batch / Safe_Expiry / Zero_Stock flags.Items simultaneously classified as Over Stock AND Near Expiry — the most critical tier. Every item here has excess units that are also approaching expiry within 90 days. Requires immediate vendor return or inter-cluster transfer. Escalate button on each row.
Items where the system confirms stockStatus='Zero Stock' AND there is active clinical demand (requested in last 3M). Sorted by AMU descending — highest-demand items first. Top 50 carry an EMG badge for emergency procurement prioritization.
Items with some physical stock remaining but will reach zero within 30 days at current usage rates. Formula: Coverage = onHand ÷ AMU < 1.0 months. Sorted by coverage ascending (most urgent first). Three urgency tiers: URGENT (<0.25mo) / WARNING (0.25–0.5mo) / MONITOR (0.5–1mo).
Items with active clinical demand (requested last 3M) but no assigned planner (planner = Not_Planned). These items have no procurement plan, no reorder trigger, and no accountability. 36 items in Jun-26 — 23 Medical Supply, 12 Pharmaceutical, 1 Non-Medical.
One row per planner: Over Stock, Slow Moving, Dead Stock, Near Expiry, Double Risk, Total Risk Items, On-Hand Units. Sorted by total risk descending. Click any row or "View OS" button to filter the Over Stock table to that planner's items only.
Tracks month-over-month improvement across 10 KPIs: Over Stock, Dead Stock, Near Expiry, Double Risk, the three rates, Unplanned Items, Zero Stock, and Critical Coverage. Live column shows current data vs. previous snapshot. Auto-snapshot fires on day 7 each month — or use 📷 Save Snapshot to capture manually.
Located on the Risk Dashboard home page. Compares 11 live KPIs against targets with status badges: ✅ On Track / ⚠ Monitor / 🟥 Critical. Includes the 3 new categories — Zero Stock, Critical Coverage, Unplanned Active all have a target of 0 (must be fully eliminated).
r[0] NUPCO Coder[2] KFMC Coder[3] Descriptionr[4] Planner Namer[8] Demand Status (UOM field)r[12] Main Categoryr[14] AMU (planned)r[33] Monthly consumption last 3Mr[38] Stock Status (Over Stock / Zero Stock / Optimum Stock…)r[76] KFMC On-Hand Totalr[77] Main NUPCO Store Stockr[98] Near_Expiry_Batch check (Reply from NUPCO)Near Expiry Quantity By Site Analysis
This system monitors inventory line items across KFMC, PMAH, and R2 clusters where the Near_exp_Qty column is greater than 0. This critical view prevents medical waste and optimizes shelf-life utilization.
- Distribution Chart: View stock count contribution ratios of near-expiry inventory by site.
- Top 5 Hazard SKUs: A bar chart highlighting the specific NUPCO items with the highest quantity of near-expiry stock.
- Action Plan: Filter, search, and target specific near-expiry batches to initiate priority transfer orders or vendor returns.
AMU/Demand Sensitivity Simulator
Located in the header configuration block, this simulator allows you to adjust the average monthly usage (AMU) from -90% to +300% and dynamically modify the Min/Max Months of Stock (MOS) targets.
- Min MOS Slider: Set the replenishment trigger point (default is 6 months). Receivers below this target are prioritized for inbound transfers.
- Sender keeps / Receiver to: the giving site always keeps 6 months of its own demand (only stock above that can move), and a receiving site below 6 months is filled up to 6 months. Both can be changed next to Run Engine.
- Demand Adjuster (%): Adjust cluster-wide demand (AMU) to simulate market contractions, epidemics, or seasonal consumption shifts.
Total SAR value: Σ (Qty × Unit Price). Capital mobilized from internal surplus — no new procurement spend.
Total count of recommended stock movements. Each order = one unique SKU moved between two sites.
Net increase in SKU-site pairs reaching Optimum Stock (6–8 months). Shows absolute +Δ items and % uplift.
Distinct NUPCO codes still at zero stock at any site after full redistribution. Cannot be resolved internally — procurement escalation required.
Items at >24 months coverage post-redistribution. Tied capital with high expiry risk — review for return-to-vendor or disposal.
| Column | What it means | How to use it |
|---|---|---|
| # Priority | Engine rank. 1 = highest urgency. | Execute top-ranked transfers first to maximize clinical & financial impact. |
| NUPCO Code | 13-digit national catalogue identifier. | Use to search, match with pharmacy system, or create warehouse pick lists. |
| From → To | Provider site → Receiver site. | Filter by “From” to generate site-specific outbound pick lists. |
| Qty | Units to physically move. | Confirm unit of measure matches between sites before initiating. |
| Value SAR | Qty × Unit Price in Saudi Riyals. | Sort descending to identify highest-impact transfers to prioritize. |
| Prov Cov ↓ | Provider months of coverage before transfer. | Validates the provider has surplus (>6 months; it keeps 6). |
| Prov After | Provider coverage remaining post-transfer. | Should remain ≥8.0 months. If not, review engine parameters. |
| Recv Before | Receiver status pill before transfer. | Red/orange pills indicate clinical urgency requiring fast execution. |
| Recv After | Projected receiver status post-transfer. | Green = Optimum Stock achieved. Yellow = partial improvement only. |
| Recv Cov ↑ | Receiver months of coverage after transfer. | Quantifies the clinical safety improvement delivered. |
| Reason | Human-readable engine justification. | Use in approval workflows and transfer documentation. |
| Column | Sheet Field | What it means & how to use it |
|---|---|---|
| NUPCO Code | NUPCO code | 13-digit national catalogue identifier. Use to cross-match with pharmacy or warehouse systems. |
| Description | Description | Full item generic name including dosage, strength, and dosage form. |
| Category | Main Category | E.g. Pharmaceutical, Medical Supply, Dietary. Use to group items for category-level analysis. |
| Site | Location | KFMC, PMAH, or R2. Filter the table to a single site for site-specific reporting. |
| Total Stock | Total_Stock | Current units on-hand at that site today as recorded in the source sheet. |
| Near Exp Qty | Near_exp_Qty | Units nearing expiry. Highlighted red when >0 — prioritize for urgent redistribution or immediate use before wastage. |
| Stock Value (SAR) | Available stock value | SAR value of current on-hand stock. Represents capital tied in inventory at this site. |
| AMU | AMU | Average Monthly Usage (primary baseline). This is the value used by the redistribution engine to calculate coverage months. |
| AMU 3M | AMU_3M | 3-month rolling average consumption. Reflects recent demand trends — compare with AMU to detect seasonal spikes. |
| AMU 12M | AMU_12M | 12-month average consumption. More stable baseline for long-term procurement planning. |
| Status (Current) | Stock Status | Coverage tier based on primary AMU: Zero Stock / Near Zero / Critical / Buffer / Optimum / Over Stock. Main decision input. |
| Status 3M | Stock Status-3M | Status if evaluated using 3-month AMU. Shows short-term risk — a worsened status vs Current indicates rising consumption trend. |
| Status 12M | Stock Status-12M | Status using 12-month AMU. Most stable view — best for annual procurement forecasting and budget planning. |
| ❤ Life Saving | Life Saving | Red badge shown for Life Saving Items. The engine escalates these to Priority 1. Use the Life Saving filter to view only these items for emergency stockout response. |
Required Excel Columns ★ = mandatory
NUPCO Code13-digit catalogue numberDescriptionItem generic nameCurrent StockUnits on-hand todayAMUAverage Monthly Usage (units/month)Unit Price SARPrice per unit in Saudi Riyals⚠️ Common Mistakes to Avoid
- Do not merge cells or add blank header rows
- AMU must be numeric — never text or blank for consumed items
- NUPCO codes must be identical across all site files for cross-matching
- Stock and AMU must use the same unit of measure
- Paste values only — do not include Excel formulas in cells
- Include all active items even if current stock is zero
Full flat file with all 22 columns. Best for Power BI, pivot tables, or database import.
Multi-sheet workbook: Results + Summary + Metrics. Best for executive leadership reporting.
Only visible rows after filter applied. Use for site-specific reports (e.g. PMAH inbound only).
Opens browser print dialog for a PDF snapshot. Ideal for board presentations and archiving.
Navigates to the linked source spreadsheet for live collaborative review with your team.
Available via the Export PDF button on the Risk Dashboard and Monthly KPI Tracker pages. Opens a clean A4 dark-theme popup window, auto-prints, then auto-closes. Enable Background Graphics in the print dialog to preserve colors.
Triggers the redistribution algorithm on current loaded data (from Pull Data or uploaded files). Re-run after data changes to refresh all results.
Fetches the live inventory CSV directly from the COPY TO MASTER EVERY TIME R2 SCM DataBase. Parses all rows across KFMC, PMAH and R2 automatically, then runs redistribution. Sheet must be shared as Anyone with the link can view.
Scans loaded data for quality issues: missing AMU, duplicate codes, zero-price items. Results shown in the Log tab.
Resets dashboard to initial seed state. Clears all uploads and returns to the built-in sample dataset.
Real-time search by NUPCO code or description. Filters the All Transfers table as you type.
❓ Why are some Zero Stock SKUs still unresolved after running the engine?
When no site holds surplus stock (>8 months) for a given SKU, the engine cannot generate a transfer. The dashboard flags these as a Critical procurement alert. Recommended: Issue an emergency purchase request to NUPCO or explore cross-cluster sourcing from Riyadh First or Third clusters.
❓ What does the “PMAH Structural Dependency” warning mean?
PMAH receives 56.6% of all redistributed value from KFMC and R2, indicating heavy reliance on inter-facility logistics. Strategic recommendation: Increase PMAH’s standalone procurement buffers for its top 20 consumed SKUs to reduce this dependency.
❓ How do we fix “No Forecast” items?
Items with AMU = 0 or blank are invisible to the engine. Action: Engage demand planning to establish monthly consumption baselines from the last 6 months of dispensing records, then update the AMU column before next upload cycle.
❓ How should we handle items with 300+ months of coverage?
Escalation path: (1) Redistribute internally first; (2) Request inter-cluster transfer to R1 or R3; (3) Negotiate return-to-vendor with NUPCO; (4) If expired/non-returnable — initiate formal disposal per MOH guidelines.
❓ How frequently should the redistribution engine be run?
Recommended: Monthly cycle aligned with your physical inventory count. For critical therapeutics (oncology, biologics, blood products) consider bi-weekly. Always re-run immediately after a major bulk delivery to capture the updated stock position.
❓ What is “Procurement Cost Avoidance”?
Financial savings achieved by fulfilling shortages through internal transfers rather than new purchase orders. Each SAR redistributed internally avoids the full procurement cost including lead time, admin overhead, and potential price escalation.
Average Monthly Usage — units consumed per month at a facility, from dispensing records.
Example: Consuming 1,200 units of a drug over 12 months equals an AMU of 100 units/month.
National Unified Procurement Company — Saudi government body assigning unique 13-digit catalogue codes.
Example: Code 1000123456789 uniquely maps to a specific brand/packaging of 500mg Paracetamol tablets.
Stock Keeping Unit — unique inventory item by NUPCO code. Can exist across multiple sites.
Example: A single NUPCO code for a pediatric antibiotic is tracked as separate SKUs at KFMC and PMAH.
Estimated months stock will last: Current Stock ÷ AMU.
Example: 400 units in stock with an AMU of 50 units/month gives 8.0 Months of Stock (MOS) coverage.
King Fahad Medical City — largest facility in the Riyadh Second Health Cluster network.
Example: Often acts as the primary provider of excess stock due to its large central purchasing power.
Prince Mohammed Al-Awwal Hospital — highest inbound redistribution dependency in the cluster.
Example: Receives targeted stock transfers from KFMC or R2 to prevent zero-stock depletion situations.
Riyadh Second cluster warehouse — major bulk stock holder, especially for commodity consumables.
Example: Central hub holding bulk quantities of high-demand items (e.g. syringes) for the cluster.
Optimization algorithm computing transfer recommendations to equalize coverage across all cluster sites.
Example: Engine triggers a transfer of 150 units from KFMC (14.0 MOS) to PMAH (1.0 MOS) to balance coverage to 8.0 MOS.
Clinical Service Level — % of critical shortage SKUs restored to Optimum Stock via redistribution.
Example: Restoring 90 out of 100 critical shortage drugs back to Optimum Stock level equals a 90.0% SLA.
SAR savings from fulfilling demand internally rather than issuing new procurement orders.
Example: Shifting 2,000 units of a SAR 50 drug avoids placing a new procurement order, saving SAR 100,000.
Annualized turnover rate (AMU × 12 / Avg Stock). Represents the frequency at which inventory is consumed and replaced annually. Mobilizing stagnant surplus assets via redistribution increases velocity (e.g. from 3.8x to 4.3x turns/year), preventing shelf-expiry, freeing locked-up capital, and boosting cluster-wide resource efficiency.
Example: A velocity of 4.3x means the cluster's average inventory pool is consumed and replenished 4.3 times per year.
Transfer between health clusters (e.g. R2 to Riyadh First) when internal redistribution is insufficient.
Example: Shipping excess items to Riyadh First Cluster when all R2 cluster sites are already fully stocked.